A long read · Live Intelligence · Earth
Rivers measures a river against itself
Seventy-five USGS gauges ranked by how far today's flow sits from each gauge's own week, with NOAA's flood stages read live. We tested the Colorado at Austin and set it beside the National Water Dashboard and NWPS.
By the LABS editorsTested 27 September 2026, 19:58–20:02 UTCA 4-minute read815 words
Chapter one · What it is
Is the river high?
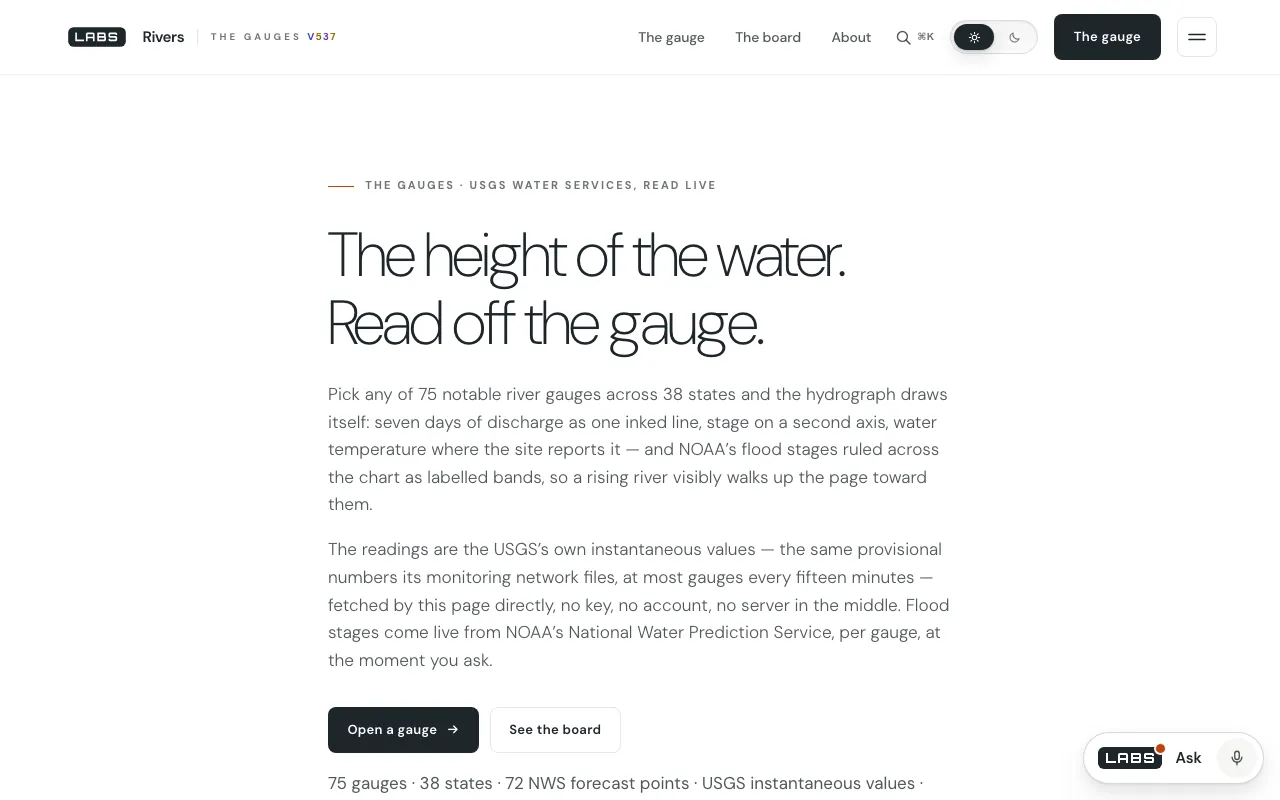
Rivers draws live hydrographs for a fixed register of 75 USGS river gauges. Pick one and you get seven days of flow and stage drawn against the National Weather Service's flood stages for that point, with water temperature where the site reports it. A board ranks all 75 rivers by how far their current flow sits above or below their own seven-day median.
It is for paddlers, anglers, riverside residents and weather watchers who want to know whether a big American river is running high right now, without first learning the USGS site-number system.
Chapter two · How it works
Two agencies, asked sparingly
The page talks directly to two government services from your browser: USGS Water Services for instantaneous and daily values, and NOAA's National Water Prediction Service for each gauge's record.1 It is frugal with both. The board fetches the whole register's daily values in a single call and current readings in batches of 25 sites; a chosen gauge gets seven days of discharge, stage and temperature, plus its NWPS record. Everything is read again every fifteen minutes.2
The ranking is the idea. Each gauge's current flow is compared with the median of its own last seven days, so a creek in spate and the Columbia at normal read on the same scale.3 Flood stages are never stored in the page. They are read live from NWPS for each gauge, so a threshold cannot go stale, and drawn on the hydrograph as the NWS ladder — action, minor, moderate, major — in the categories' own colours.4 The register itself was checked by hand: 72 of the 75 gauges are NWS forecast points.
Chapter three · The test
The Colorado at Austin
We loaded the page from a local copy of build 537 at 19:58:54 UTC on 27 September 2026 (54,901 bytes), then requested the seven-day readings the page builds for the Colorado River at Austin, USGS 08158000, at 19:59:20 UTC. The service answered in 0.71 seconds with 322,778 bytes and an open CORS header: 2,015 discharge readings, the latest 222 cubic feet per second and marked provisional, and 2,015 stage readings, the latest 12.97 feet. This site reports no water temperature.5
At 19:59:23 UTC the NWPS record for the same gauge set the flood categories at 25 feet for action, 33 for minor, 38 for moderate and 42 for major, with 13.01 feet observed and no flooding. The river stood roughly half-way to action stage.
Chapter four · Against the field
The National Water Dashboard and NWPS
USGS National Water Dashboard
Page read 27 September 2026, 20:02 UTC, via its drought.gov entry
The Dashboard maps provisional real-time stream, lake, reservoir, rainfall, water-quality and groundwater data from more than 13,500 USGS stations, alongside NOAA radar, watches, warnings and drought layers, and links to WaterAlert notifications.
Where it is betterEvery reporting station rather than 75, weather layers on the same map, and threshold alerts.
Where Rivers goes furtherIt gives one ranked board of how unusual each river is against its own week, and draws the flood ladder from the live NWPS record directly on each hydrograph.6
NOAA National Water Prediction Service
Page read 27 September 2026, 20:02 UTC, via drought.gov and its API
NWPS is the National Weather Service's river service: observations and forecasts for each gauge with hydrographs, flood categories, upstream and downstream hydrographs in one click, National Water Model guidance and long-range flood outlooks.
Where it is betterForecasts — where the river is going, not only where it has been — and long-range outlooks.
Where Rivers goes furtherIt joins NWPS thresholds to a week of USGS discharge, stage and temperature on one canvas, and adds the cross-river ranking.
Chapter five · Where it falls short
The forecast it already holds
The most striking gap is one the page has already paid for. The NWPS record it fetches for the Colorado at Austin carried a forecast — 16.7 feet for 1 October — but the code uses only the flood thresholds, and the word 'forecast' appears only in a label.7 NWPS draws that forecast; Rivers does not.
Seventy-five gauges is a small share of the thousands USGS runs, so if your river is not in the register there is nothing to pick. There are no alerts of the kind WaterAlert sends. And if the USGS endpoints go down there is no fallback source in the code.
Chapter six · The verdict
A fair scale for every river
Rivers' good idea is to compare each river with its own recent week; its good manners are to batch its requests and to read flood stages live rather than copy them. On the evening we tested, it would have shown the Colorado at Austin at 12.97 feet against a 25-foot action stage — calm, and correctly measured.
For the forecast, and for a message when the water rises, go to NOAA's NWPS and the USGS dashboard.
Every river judged against its own week, with the flood ladder read fresh each time.
Notes on the evidence
Paths are in the labs.llc build 537 tree; times are UTC on 27 September 2026.
rivers/assets/js/app.jslines 15–17.app.jsheader lines 8–11; lines 18, 129, 141, 248 and 261.app.jslines 85, 129–134, 167 and 170–173.rivers/assets/js/gauges.jsheader lines 1–8;app.jslines 20–25 and 261.- Page at 19:58:54 UTC; USGS instantaneous values for 08158000 (discharge, stage, temperature; seven days) at 19:59:20 UTC; NWPS gauge ACRT2 at 19:59:23 UTC.
app.jslines 167–173, 20–25 and 261.- The only 'forecast' in
app.jsis the label at line 307; the endpoints at lines 15–16 have no fallback.